
A cloud pentest came back sort of clean in 2025. But here’s what is gonna make you reconsider your pentest decisions (something along these lines). A mobile test on the same company’s iOS app revealed hardcoded AWS credentials in the binary. 80% of tracked S3 and AWS credential exposures last year were found that way in mobile apps, not cloud scans.
So if you are sizing up your security program for the year ahead, penetration testing statistics are among the clearest signals you have, and this year, the story is different from the numbers you have been quoting since 2023. The headline being:
Most security programs aren’t under-secured. They’re mis-measured.
This roundup pulls together the most important penetration testing statistics for 2026 from credible sources and our own State of Continuous Pentesting Report 2026, a dataset of 6.8 million findings drawn from 150,000+ scans and 8,000+ pentest engagements across web, API, cloud, mobile, and network infrastructure, supplemented with current market figures and third-party breach data.









We’ve grouped the stats so you can jump to what matters to you:
- The severity shift
- Timing & Seasonality
- Cloud
- Vulnerability classes
- Testing coverage
- Autonomous pentesting
- Market size
Wherever a number reflects both a growing threat landscape and Astra’s own platform growth, we’ve flagged it so you can read it fairly.
Recommended reading: 160 Cybersecurity Statistics for 2026 | Ransomware Attack Statistics
Top penetration testing statistics for 2026
- Astra Security discovered 6.8 million vulnerabilities in 2025, a 275% increase over the previous year (reflecting both a wider threat surface and platform growth).
- Critical vulnerabilities grew at 14.6x the rate of everything else in 2025; severity, not volume, is the story of the year.
- Roughly 1 in 10 findings was critical in 2025, up from about 1 in 40 in 2024.
- A critical vulnerability was found every 48 seconds in 2025, up from once every 12 minutes in 2024, a 15x acceleration.
- Cloud vulnerabilities grew 44x in a single year and now make up 39% of all findings.
- Cloud overtook the web as the primary attack surface in three quarters of 2025.
- IDOR was the single costliest vulnerability class, tied to $1.1M in tracked financial exposure and present on all six tested surfaces at once.
- Total tracked financial exposure across the dataset reached $2.37B in 2025.
- Autonomous pentesting returns a first finding in minutes, up to 80x faster than a traditional quarterly testing cycle.
Vulnerability volume and severity statistics
The 275% growth headline hides the number that matters. Volume and severity moved in opposite directions in 2025, and any dashboard that counts findings without sorting them by severity is now structurally misleading.
- Total vulnerability volume grew 275%, but critical vulnerabilities alone grew nearly 4x while low-severity issues rose only about 1.5x.
- Critical findings grew 1,360% year over year, the fastest-growing tier by a wide margin.
- Critical vulnerabilities rose from 2.3% of all findings in 2024 to 9.5% in 2025, a +7.2 percentage-point shift.
- High-severity findings grew 315% and rose to 8.5% of the mix.
- Low-severity findings fell from 40.6% of the mix to 28.8% (-11.8 pp). The severity floor is rising.
- If the composition trend holds, 1 in 5 findings will be critical by the end of 2026.
- Astra’s forecast models point to at least 2.7x total vulnerability growth in 2026 a direction, not a guarantee.
- Manual pentest findings grew 19.7x in 2025, where human judgment filters noise before a finding is logged.
- Astra’s own market-share growth accounted for only about 11.5% of that manual-finding increase; the rest reflects real attack-surface expansion into cloud, API, and network.
The severity breakdown makes the shift explicit: every finding added to the count in 2025 is, on average, more dangerous than one added in 2024:
| Severity | 2025 share | 2024 share | Share shift | Count growth |
|---|---|---|---|---|
| Critical | 9.5% | 2.3% | +7.2 pp | 1,360% |
| High | 8.5% | 7.2% | +1.3 pp | 315% |
| Medium | 34.3% | 35.1% | -0.8 pp | 243% |
| Low | 28.8% | 40.6% | -11.8 pp | 149% |
| Info | 19.0% | 14.8% | +4.2 pp | 352% |
Timing and seasonality statistics
Vulnerability growth in 2025 was episodic, not linear, and the most dangerous month was not the one with the most findings. There is a 30-day gap sitting inside most security dashboards.
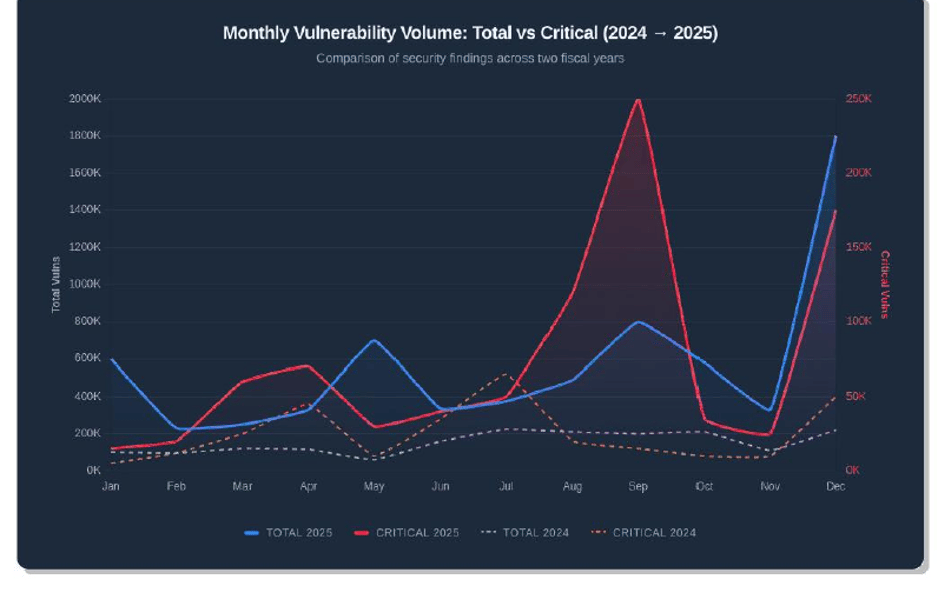
Fig 1: Monthly vulnerability volume, 2024 vs 2025. December 2025 alone (1.8M) exceeds the full 2024 annual total. (Source: Astra State of Continuous Pentesting Report 2026)
- December 2025 alone produced 1.8 million vulnerabilities; more than the entire year of 2024 combined.
- January 2025 opened with 600K findings, 6x the same month a year earlier.
- September 2025 produced 700K+ findings and the year’s highest concentration of critical findings.
- November was the lowest-scanning month of 2025, roughly half the volume of January, setting up December’s surge.
- This month’s scan volume explains about 43% of next month’s risk, sitting 30 days ahead of where most teams are looking.
- Same-month scan volume has essentially no predictive value for the same month’s findings.
- September produced more criticals than all of 2024 combined; then, in October, the critical count dropped by 87%. That does not mean that the risk got resolved; it just moved.
- October produced the year’s highest count of high-severity findings, nearly twice September’s, as unfixed criticals were reclassified one tier down.
- Q4 2025 had the most raw findings of any quarter (63% more than Q3), but Q3 was 29% more dangerous per finding.
- In December, there were roughly 4 low-priority findings for every serious one; in September, nearly half of all findings were critical or high.
Cloud Attack Surface Statistics
In 2024, the industry framed the web as the primary surface and cloud as an emerging concern. In 2025, that has inverted, with most testing budgets lagging.
Fig 2: Vulnerability volume by surface, 2024 vs 2025. Cloud went from 3% to 39% of volume in a single year. (Source: Astra State of Continuous Pentesting Report 2026)
- 2025 saw a 44x increase in cloud-origin vulnerabilities compared to 2024. From 60K to 2.6M, while web was at 1.7M
- Cloud now represents 39% of all vulnerabilities discovered.
- API-layer vulnerabilities grew 8.7x in the last 12 months, sitting at the junction between cloud and the web apps you already test.
- Cloud vulnerability growth outpaced cloud testing growth by 37x (44x growth against just 1.23x more engagements).
- A cloud pentest returns an average of 7,480 findings per engagement, which is 2.4x the yield of a web test (3,060).
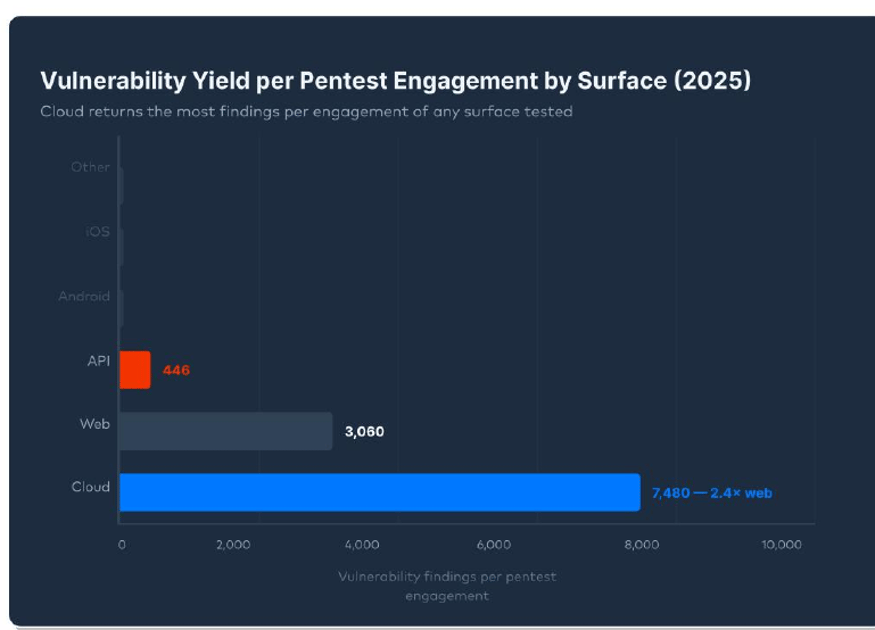
Fig 3: Vulnerability yield per pentest engagement by surface. Cloud returns 2.4x the findings of a web test. (Source: Astra State of Continuous Pentesting Report 2026)
- Cloud receives just 14% of pentest engagements while generating 39% of the volume, leaving it underfunded by roughly 3x.
- 80% of tracked S3 and AWS credential exposures were found in iOS and Android apps, NOT in cloud infrastructure scans.
- Cloud credentials embedded in mobile apps had $1.1M in tracked exposure before anyone deliberately looked for them.
- May 2025 saw the sharpest cloud-over-web inversion at 2.5:1; January opened at 1.7:1.
- Cloud appears in the surface-engagement mix for 55% of customers, second only to web at 87%.
- With its scanner in its first full year, API tracked exposure is projected to reach $3.3M in 2026 (up from $2.6M in 2025), alongside roughly 185K automated API findings.
Vulnerability class statistics
The vulnerability classes of 2025 salivating to give your finance team exposure nightmares are actually architectural and logical flaws, not patchable bugs with no CVE and no vendor fix.
Fig 4: IDOR financial exposure by asset surface is the only vulnerability class present across all six. (Source: Astra State of Continuous Pentesting Report 2026)
- IDOR carried $1.1M in tracked exposure, the highest of any class, and appeared on all six tested surfaces.
- Authentication bypass via response manipulation accounted for $344K in tracked exposure.
- Privilege escalation via state manipulation accounted for $290K.
- None of the top three loss-driving classes has a CVE or vendor patch; they are design flaws requiring code review and developer education.
- CVE disclosures tracked on Astra’s platform fell 91%, from 91 in 2024 to 8 in 2025. This showcases a deliberate shift toward architectural testing.
- Industry-wide CVEs hit a record 48K+ in 2025, up 22% year over year.
- Automated finding volume grew 3.1x from 2024 to 2025.
- Human-vetted findings declined 36% over the same period, even as the volume they review expanded.
- Vetted findings fell from 0.89% of automated volume in 2024 to 0.18% in 2025; the confirmation layer is contracting.
- If automated volume triples again in 2026, the human-vetted rate is set to fall below 0.1%, which entails just 1 confirmed finding per 1,000.
- Prompt injection via API and exposed system prompts appeared in production pentests in 2025 at $17,500 each, a vulnerability class that wasn’t in triage queues in 2024.
- AI-related vulnerability classes accounted for $35K in tracked exposure across just two production instances, signaling an arrival, hopefully not an explosive trend in the making.
- Server-Side Request Forgery (SSRF) appeared at $25,000 per tracked instance in API and other pentests.
Testing coverage and industry statistics
These fresh 2026 stats oblige us not to say ‘what was here when we looked?’ Rather answer ‘what is here now?‘ That is where Continuous Autonomous testing coupled with manual expertise becomes indispensable.
In an environment with a critical vulnerability arriving every 48 seconds, the gap between those two questions is a measure of how long your firm sits blind and threat actors are basking through your tech stack.
Fig 5: Customer testing patterns. 22% ran a single engagement; 29% tested only one surface. (Source: Astra State of Continuous Pentesting Report 2026)
- 22% of organizations ran a single engagement in 2025 and did not return.
- 29% of organizations test only a single attack surface with accurate data on just one vector; they have no insight into how it connects to the rest. And that is what the threat actors bank on.
- 37% of organizations run 3 or more surfaces under continuous coverage.
- 78% of customers run recurring testing; 22% tested only once.
- Manufacturing and energy make up 5% of testing customers, that too with 0 cloud, API, or mobile coverage in the dataset, despite being top nation-state targets.
- Manufacturing recorded 3,837 security incidents and 1,607 confirmed breaches in 2025, the highest of any sector (Verizon DBIR).
- Espionage motivated 20% of manufacturing breaches in 2025, up from 3% the year before.
- In energy and utilities, espionage drove 66% of confirmed breaches, again the highest of any sector, while ransomware volume surged 80% year over year.
- The dataset spans 8,000+ engagements across 1,000+ organizations in 70 countries.
- By surface engagement, web leads at 87%, followed by cloud at 55%, API at 38%, mobile at 34%, and network at 22%.
- By customer industry: IT & tech 48%, fintech 14%, healthcare 13%, edtech 7%, media 6%, and manufacturing & energy 5%.
- Healthcare and banking appear in the evaluation pool above their current customer share. This could be a sign of tightening regulatory pressure and breach risk.
Autonomous pentesting and OWASP APTS statistics
Testing cadence is shifting from quarterly to continuous. As autonomous pentesting platforms start making exploitation decisions on production systems, governance, not speed, becomes the open question (and it’s a different job from red teaming).
- Autonomous pentesting returns a first finding in minutes, not weeks, which is ~80x faster than quarterly testing, with coverage on every deployment.
- Astra’s autonomous engine is trained on 4,000+ real pentests and 10M+ vulnerabilities.
- The OWASP Autonomous Penetration Testing Standard (APTS), co-created by Astra in early 2026, defines 173 requirements across governance domains.
- APTS specifies 3 compliance tiers (Foundation, Verified, Comprehensive) and 4 autonomy levels (L1–L4).
- Manual pentesting dominated 2024 (quarterly), AI-augmented testing emerged in 2025 (monthly), and autonomous platforms scale in 2026 (continuous).
- On established scopes, AI-augmented testing delivers a steady 3x ongoing yield. The 20x headline figure is driven by first-engagement backlog harvests rather than repeatable efficiency.
Penetration testing market statistics
For context beyond the platform data, here’s where independent analysts put the pentesting market heading into 2026. Estimates vary with scope and methodology, so treat them as a range rather than a single figure.
- The global penetration testing market is estimated at roughly $2.72B in 2026, projected to reach $5.54B by 2031 (15.29% CAGR, Mordor Intelligence).
- Other estimates put the 2026 market at $3.09B, growing to $7.41B by 2034 at an 11.6% CAGR (Fortune Business Insights).
- The PTaaS segment specifically is forecast to grow at a 22.6% CAGR, reaching $1.98B by 2031 (MarketsandMarkets).
Two caveats worth keeping in mind:
First, the financial-exposure figures are modeled potential-loss estimates calculated by applying breach-cost models to confirmed vulnerability instances, not observed breach costs; they exist to help you prioritize risk, not to predict an actual loss.
Second, several growth figures reflect a combination of a genuinely expanding threat landscape and growth in Astra’s platform adoption and testing coverage. Where both factors are material, we’ve said so.
The takeaway for 2026
If there is one thread running through these penetration testing statistics, it’s that the metric most programs still report, total vulnerability count, has decoupled from actual risk. The findings that drove the most exposure in 2025 were critical, cross-surface, architectural, and increasingly cloud-native. They didn’t announce themselves in a monthly count, and many don’t have a CVE to track.
The programs that will look back on 2026 clearly won’t be the ones that found the most vulnerabilities. They’ll be the ones that found the right ones on the right surfaces, before the wrong month decided for them.
If you want to pressure-test your own coverage, a continuous penetration test or VAPT engagement is the fastest way to see what your dashboard is missing.
For the full dataset, methodology, and charts behind these numbers, we suggest you check out Astra’s State of Continuous Pentesting Report 2026.
FAQS
What is the penetration testing market size?
The global penetration testing market is valued at around $2.5 billion in 2025 and is projected to reach $6.5 billion by 2030, growing at a CAGR of nearly 17%. Rising cyberattacks, cloud adoption, and compliance mandates like SOC 2 and PCI DSS drive this rapid growth.